Insights
Why unrealized losses at Japanese banks are only 5-10% of the US
Harry Ishihara, Macro Strategist


Introduction: Why Japanese banks became bond investors
Japan’s asset bubble from 1987 through 1990 was caused by the super easy economic policies that followed the Plaza Accord of September 1985. The five nation Accord was led by the US and targeted Japan’s trade surplus by coordinating a weakening of the dollar and strengthening of the yen[1]. In 1986, the US-Japan Semiconductor Agreement imposed trade restrictions on the Japanese semiconductor industry and forced them to accept prices set by the US, which allowed competitors to undercut them. By the end of 1986, the yen had strengthened 46%, and the economy “essentially halted” (IMF). Powerful stimulus was needed.
[1]The five nations were the US, Japan, UK, Germany and France. For details, see “Did the Plaza Accord Cause Japan’s Lost Decades?” Jan 2011, IMF.
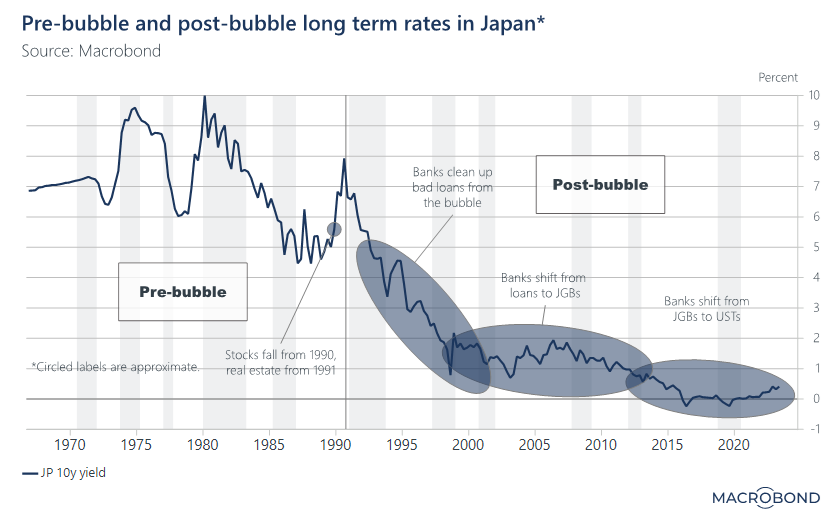
During the bubble that ensued, asset valuations went amok. Real estate in central Tokyo was reportedly worth more than all of the US, while listings on the Tokyo stock exchange were worth more than all US equity (Nikkei news). Regulations to slow the bubble caused stocks, then real estate, to crash from the early 90s, once again halting the economy.
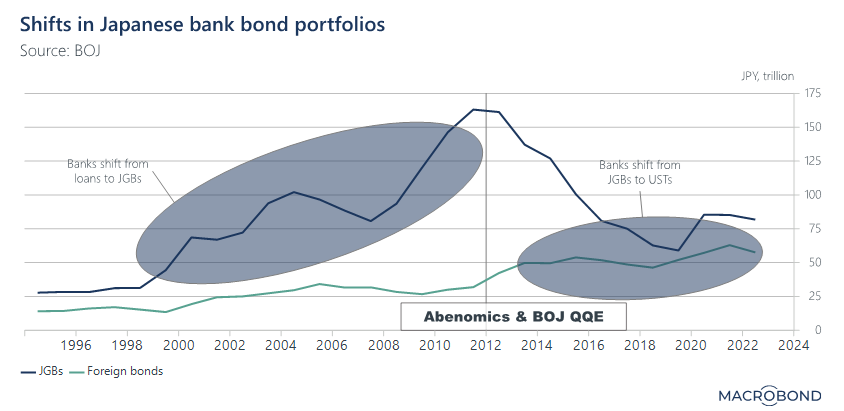
In the post-bubble period, Japanese banks made two major changes to their balance sheets as growth slowed and rates plunged (next graph). One was a shift from loans to Japanese government bonds (JGBs) as loan growth slowed. The second was a shift from JGBs to US treasuries (USTs) as Abenomics/BOJ policies drove long term rates to zero.
Quality and liquidity required
Japanese banks also invest in other regions, but to a lesser extent. They prefer high quality, liquid markets to minimize regulatory capital requirements and to trade in size, which can be in billions of dollars at a time. Most of the US bonds are in the form of long-term US treasuries, followed by mortgage backed securities and investment grade corporate bonds.
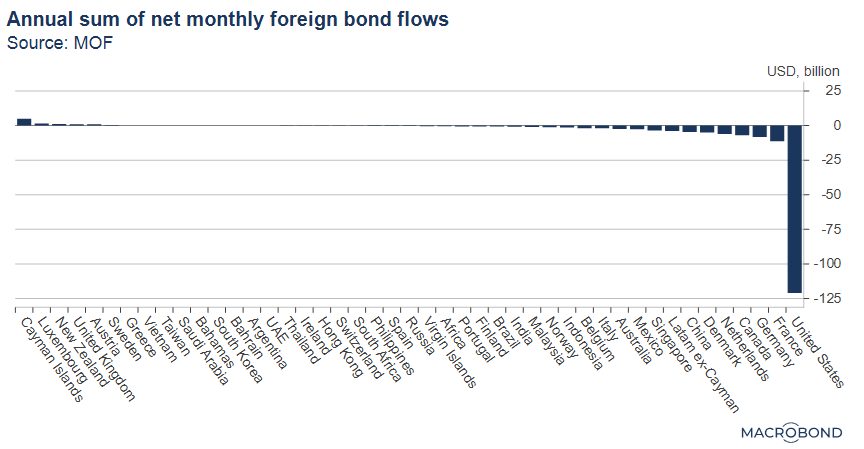
However, as the Fed started tightening in 2022, Japanese banks and life insurers cut and/or hedged their US rate exposure, as the following chart implies (reflects all 2022 Japanese foreign bond flows other than the Ministry of Finance’s foreign currency reserve operations).
Different incentives from the US
In both the US and Japan, accounting for bonds generally use three buckets. 1) Held to maturity (HTM), where unrealized losses are NOT reflected in the financial statements, 2) Available for sale (AFS), where unrealized losses are reflected in the balance sheet but not the income statement, and 3) Trading, where unrealized losses are reflected in the income statement and feed through to the balance sheet. When investing, banks shy away from the Trading bucket as it causes too much volatility to their earnings.
Japanese banks predominantly use AFS for their investments and avoid HTM. One Japanese mega-bank admittedly uses HTM for about 20% of their bond investments, but that is unusually large and still pales to the 50-70% of some large US banks (Nikkei news).
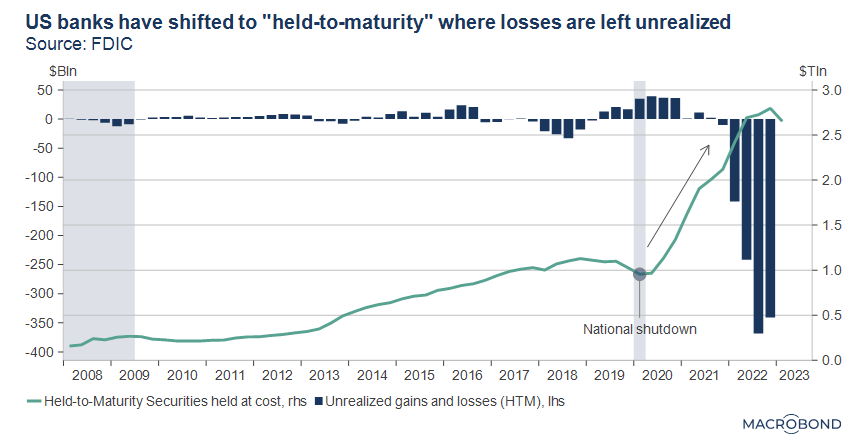
US banks, especially large US banks, have accounting and sometimes regulatory incentives to use HTM. For large US banks, HTM bonds can be counted as a high-quality liquid asset for liquidity ratio purposes. Also, unrealized losses on AFS bonds reduce regulatory capital [2]. Thus, the industry’s portfolio, including smaller banks, is split nearly 50/50 between AFS and HTM. As unrealized HTM losses are not reflected in the financial statements and buried in the accompanying notes, HTM is sometimes coined “hide-to-maturity”. This behavior was seen as a cause of recent SVB and other US bank failures.
[2] “The Implications of Unrealized Losses for Banks,” April 2023, Kansas City Fed
How much did they lose?
Industry data on Japanese banks’ unrealized foreign bond losses get rolled up into a balance sheet item called, “Valuation difference on available-for-sale securities”, reported by the BOJ. This reports total unrealized gains and losses from all AFS holdings. As the next chart shows, it remains positive due to unrealized GAINS that banks have on their EQUITY holdings.
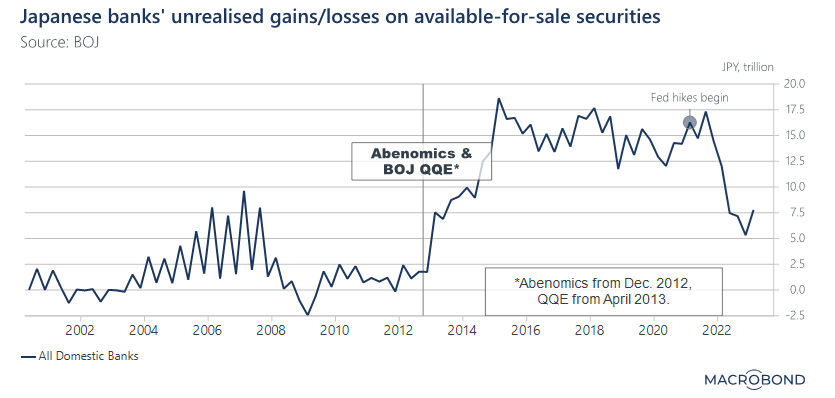
Thus, official Japanese industry data for unrealized gains/losses is just for AFS and is skewed positively by the equity gains, while US industry data is for both AFS and HTM with negligible equity exposure. Thus, to compare Japanese banks’ bond losses with the US, we compiled data from press reports on Japanese banks’ FOREIGN bond losses.
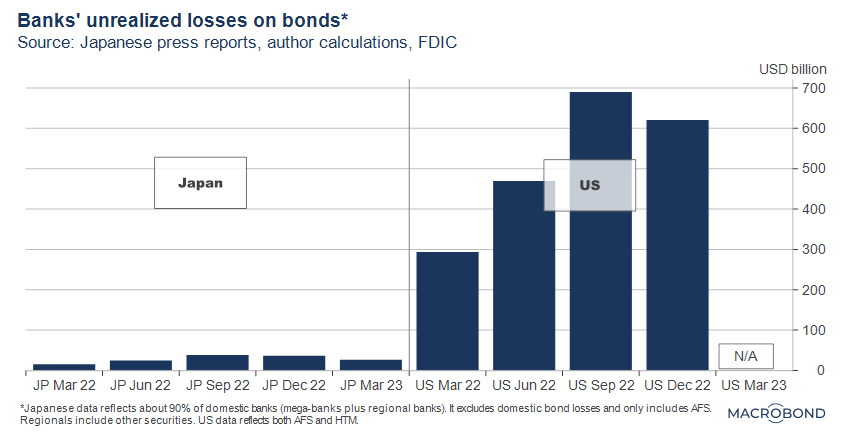
That data, which we will illustrate in our final chart, implies Japanese banks’ unrealized losses peaked at about USD 39 billion in September 2022, vs USD 690 billion for the US. Although the data compares AFS FOREIGN bond losses on the Japan side with AFS plus HTM losses on ALL securities on the US side, we think it is a fair comparison. Japan’s DOMESTIC bond losses were very small, and as noted earlier, HTM use is generally avoided.
Why did Japanese banks do better?
We can think of two reasons: incentives and experience, but Japanese banks cannot brag.
1) Incentives. The aggressive use of HTM in the US, especially post-Corona, was probably one factor (graph below).
Unrealized losses for Japanese banks, who are predominantly AFS holders, got reflected in their financial statements, giving them an incentive to minimize them. Meanwhile, as we noted earlier, US bank holdings and unrealized losses were closer to 50% HTM, meaning about half of their unrealized losses were effectively hidden from the financials. As we noted earlier, large US banks also have stronger regulatory incentives to use HTM [3] - they can count HTM assets towards their liquidity ratios - while large Japanese banks cannot.
[3] This may be due to stronger financial lobbying in the US. According to Forbes, there were over 4 financial lobbyists per US congressman in 2018, the same ratio as ten years ago.
2) Experience. In general, Japanese banks are well experienced with rate risk due to the BOJ’s ultra-low interest rate policies from the mid-90’s. Ignoring a hike in the early 2000s, short term rates went to zero, then negative in later years. The 10 year government bond yield has stayed below 1 percent for over ten years, and has been pegged at around zero (!) for the past seven. Yet, as a former US bank analyst, I noticed Japanese banks STILL prefer rate risk to credit risk when investing in bonds, especially compared to their US rivals.
On the flip side, shunning credit risk in their bond portfolios probably hurts Japanese banks’ profitability over the long run. And in general, consolidated ROE and ROA metrics are still very low by US standards, even after allowing for accounting differences. The outperformance of bond portfolios during the Fed hikes is not being bragged about, and in general, Japan’s banks continue to look for business opportunities abroad.
About half the size, but only 5-10% of the loss
As the Fed hiked, Japanese banks appeared to have fared much better than US banks. Our best-effort comparison in the chart above implies peak unrealized bond losses of USD 39 billion for Japanese banks vs USD 690 billion for US banks.
Japanese losses would be slightly higher if domestic bond losses had been included.
But how about the size of the two industries? Excluding foreign banks from both sides, but ignoring accounting differences, we estimate that total assets of the Japanese banking industry are about 50-60% of the US depending on the exchange rate used. Yet unrealized losses appear to be about 5-10% of the US, and slightly higher if domestic bond losses had been included.
So, it appears that Japanese banks nicely outperformed the US, at least based on THIS comparison. But the industry’s overall return on assets still has plenty of room for improvement.
Related links