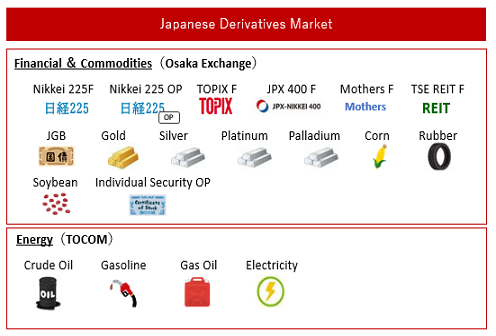
OSE Derivatives
Helixtap Rubber Market Outlook Report 2023: Historical oversupply likely to start easing from 2023
Helixtap


Highlights
- Annual natural production ran a surplus in 6 out of the past 9 years
- An oversupplied rubber market resulted in inventory building up cumulatively over the years with prices trending downwards at the same time
- Rubber prices still under downward pressure despite possible overconsumption in 2022
- Global rubber market likely to be oversupplied in 2023
- Rubber oversupply possibly to start easing due to declining margins against more profitable palm oil
Annual natural rubber production running at a surplus in 6 out of the past 9 years
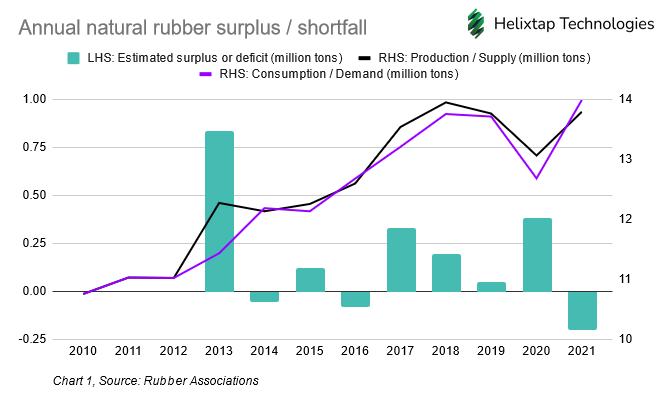
In the 9 years from 2013 to 2021, a surplus in rubber production was observed in most years. Before that, production and consumption were at parity from 2010 to 2012. The highest recorded surplus within this period was an 840,000 tons surplus in 2013 while the largest deficit of 200,000 tons was seen last year. Without taking account of actual inventory levels in the market during the same period, an oversupplied market will likely put downward pressure on prices. In theory, high consumption levels in the subsequent year following an oversupplied year will offset any production surplus accumulated the previous year. However, consecutive production surplus years will cumulatively add on to the overall global inventory, resulting in the market being constantly oversupplied.
An oversupplied rubber market resulted in inventory building up cumulatively over the years with prices trending downwards at the same time
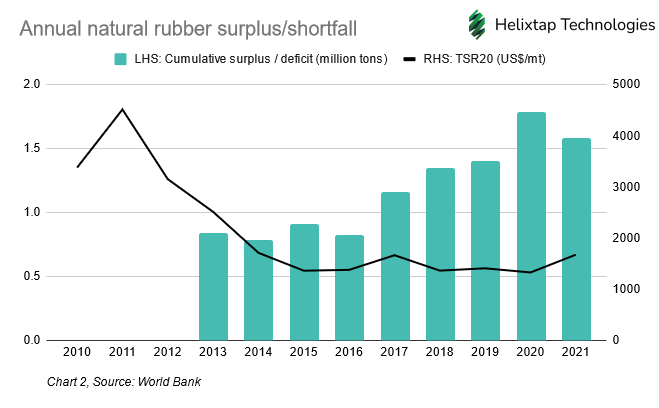
With most years running a production surplus from 2013 to 2021, excess supply or inventory was building in the market consistently from 2013 onward. The cumulative production surplus subsequently peaked in 2020 at 1.8 million tonnes before coming down in 2021 as demand recovered with the easing of the global Covid-19 pandemic. The buildup of excess supply in the market coincided with rubber prices trending downwards at the same time. TSR20 prices fell by 63% from US$4,518/mt in 2011 to US$1,678/mt in 2021. The data and price dynamics quite conclusively and retrospectively proved an oversupplied natural rubber market in the last 9 years. Such a trend was reflected in the market intelligence collected by Helixtap. Many market participants echoed the existence of a supply glut as well as price competition amongst rubber grades in order to maintain cash flows. It must however be noted that such data do not include existing inventories held by private companies in the industry from 2010 onward.
Rubber prices under downward pressure despite possible overconsumption in 2022
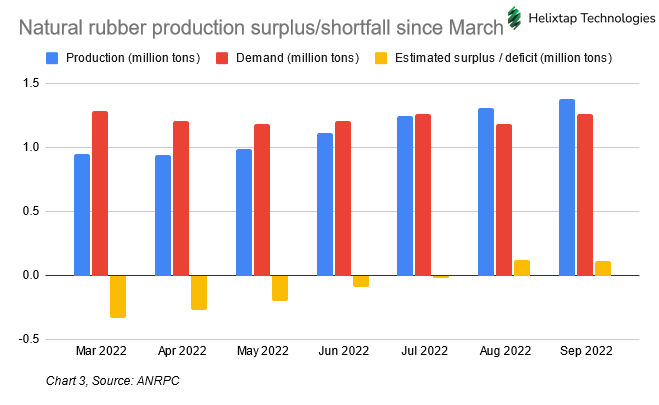
In the past months, net rubber production has mostly been at a deficit, only turning into a surplus in the past 2 months from August to September. Despite the recent drop in demand, it is quite likely that 2022 will have overconsumption where rubber demand outstrips supply. If this materialises, it would be the first time since 2010 where two consecutive years recorded an overconsumption of rubber. Even with demand outpacing supply this year, such a trend did not provide much support to global rubber prices. As of end-October, STR20, SIR20 and AFR10 and first position SICOM TSR20 prices have fallen by at least 30% since the year began. The net shortfall of 0.7 million tonnes as of September this year is still lower than the 1.6 million tonnes cumulative production surplus as of end-2021.
Chinese warehouse inventory at its highest level year-to-date
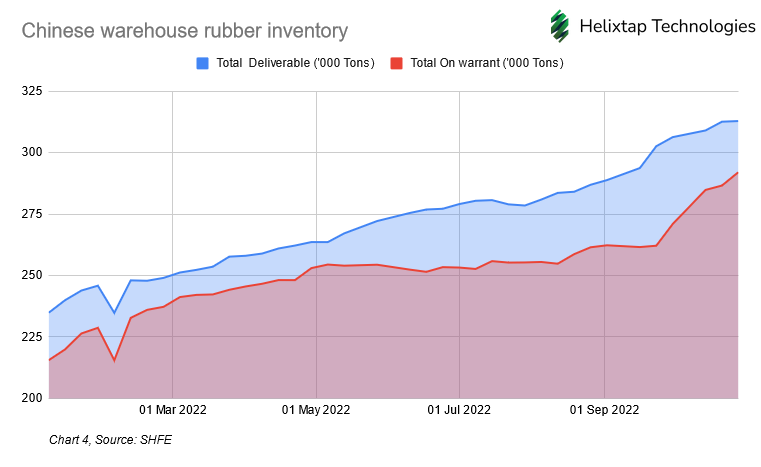
It is logical to expect inventories to be drawn down in a period when demand exceeds supply. In contrast, SHFE inventories have been rising consistently throughout most of this year. While such a trend likely reflects the slowing Chinese demand due to their strict zero-Covid policy, China as a single market also accounts for almost half of global natural rubber consumption. With actual global inventory data not available, SHFE inventory data presents the only publicly available data set to proxy the global natural rubber inventory levels.
Indicators such as positive cumulative production surplus, falling global natural rubber prices in an overconsumption year and increasing inventory levels all point towards the rubber market being likely oversupplied again in 2023. Such a trend might put further downward pressure on already low rubber prices and thinning margins for processors.
Rubber oversupply possibly to start easing from 2023 due to declining margins against more profitable palm oil
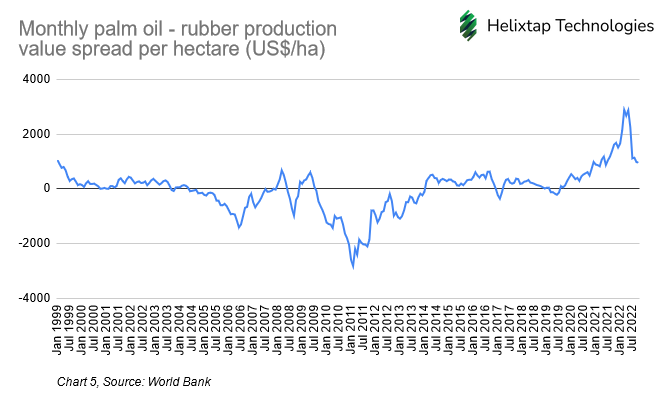
But any rubber oversupply might possibly start to ease from 2023 onwards due to declining margins against the more profitable palm oil. An alternative planting asset such as palm oil was picked as it is the most economically valuable commodity within the agriculture space, requiring similar resources and skill sets to grow. For the above analysis, per-hectare yield values for both rubber and palm oil are calculated based on the US Dollar return each hectare of land is able to give producers. Then, this value spread is calculated by deducting the rubber per-hectare value from palm oil.
From 2004 up till 2014, the spread was negative, suggesting rubber as the more profitable commodity to plant. Adding about 7 years to this duration as the average time it takes for a rubber tree to be productive, it would reflect an increase in supply possibly between 2011 till 2018. From Chart 1 above, excess production of around 840,000 tons of rubber was recorded in 2013. Since then, the cumulative surplus in the second chart also continued to build up, with the jump in 2017-2018 corresponding to the 2010-2011 period. This period was also where planting rubber trees was significantly more valuable per hectare than oil palms. The data seems to suggest beyond other factors under consideration, profit margin for rubber vis-a-vis other planting assets is a key factor in determining which asset to plant in a farm. Understanding this margin and monitoring it would then be crucial in possibly predicting future rubber supply.
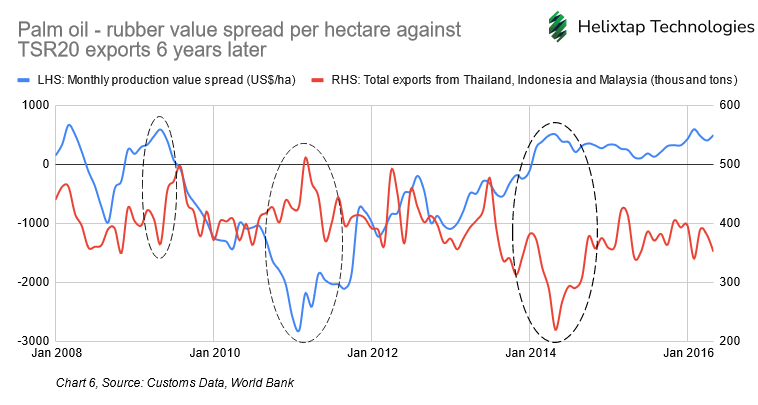
Indeed, if we plot the margins against rubber exports 6 years into the future, a clear inverse relationship is present during certain periods of time. For example, we compare margins in January 2012 against rubber exports from Thailand, Indonesia and Malaysia in January 2018. As shown in the dotted ovals, total TSR exports from the 3 regions increased when the spread moved strongly in the opposite direction. For the rightmost oval, the drop in exports may have been exacerbated by a drop in demand during 2020 due to the global pandemic. This export behaviour is reflective of plantation owners making the decision to plant rubber trees as rubber or oil palm become more valuable, and resulting in changes in production after the trees become commercially productive. When the spread increases, TSR exports fall and when the spread decreases, TSR exports increase. There are certainly other factors to consider when deciding what planting asset to farm. But the various trends from the data seems to suggest planting margins per hectare is one such key consideration factor.
Several reasons could cause the chart not to be in complete sync. One reason could be that the different timing planting decisions were made by different farmers in response to the margins. It could also be due to the life cycle of harvesting between plantations and weather affecting tapping activities.
Recent prices show thin margins for the Thais and negative margins for Indo sellers
An oversupplied market will likely see prices trend further downwards. But low rubber processing margins might provide price floor effect to rubber prices, with negative margins potentially clearing some of the supply overhang in the market.
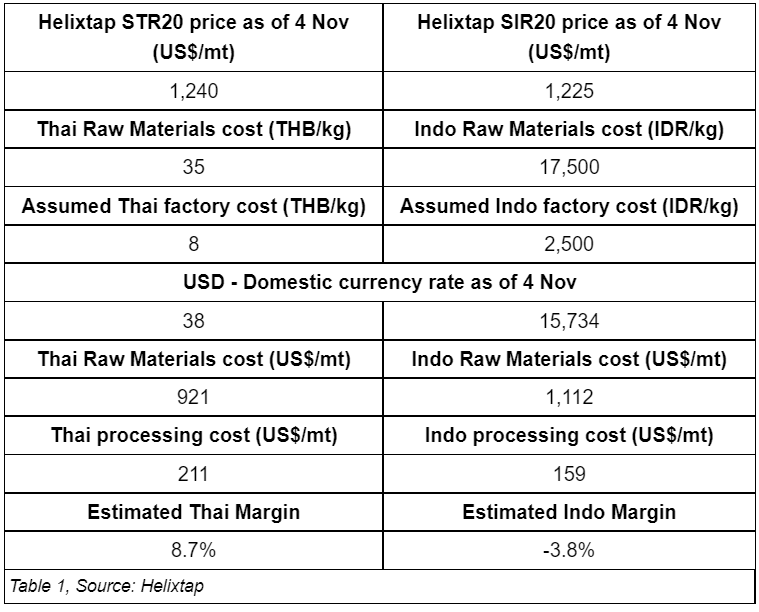
Since the Helixtap Margin report for H1 was published in July this year, the estimated Indo margin continued to decrease from -2.9% to the current -3.8%. Additional Indonesian factories have also ceased operations due to the poor operating environment in terms of pricing and sourcing of raw material. On the other hand, the Thai margin increased slightly from 6.9% to 8.7%, due to a combination of a strong US dollar and lower raw material prices despite STR20 prices falling.
Indonesian importers tapped on overseas raw material at higher frequency due to poor domestic processing margins
As margins have become negative due to comparatively higher Indo raw material prices, Indo processors have likely resorted to importing from overseas to reduce costs and keep factories operational, maintaining existing cash flows.
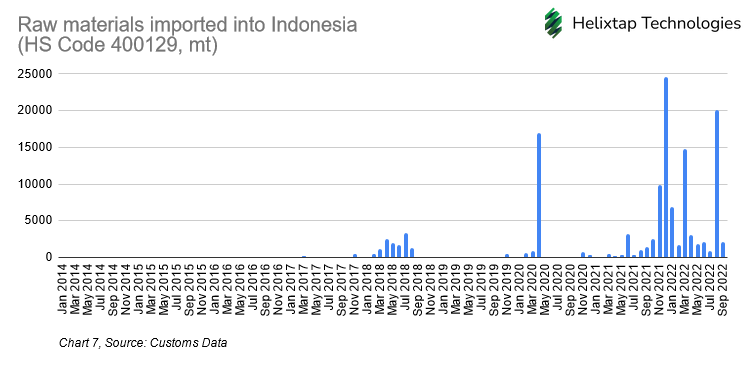
More regular imports of overseas raw material into Indonesia from October 2021 onwards coincided with thinning or negative domestic Indonesian rubber processing margin. Using cheaper raw materials from overseas compared with domestic Indonesian raw material is an avenue for Indonesian processors to stay competitive and in business. Market forces suggest thinning or negative margins will continue to persist as long as the rubber market is oversupplied. A correction of market dynamics would require plant closures to clear the supply overhang in the market. With palm oil being at a positive margin over rubber since July 2019, the rubber market might be at the start of the next peak price cycle due in 2025, maybe as early as next year.
Helixtap physical rubber price assessments are market-surveyed prices across the supply chain and key demand nodes. These assessments are published based on a robust pricing methodology and are more reflective of the physical rubber market. For access to these price assessments, please contact alvin@helixtap.com