Insights
Currency carry trades and market uncertainty
Ryuta Sakemoto, Hokkaido University


Currency carry trades have been widely adopted by investors due to their high average returns. These trades involve borrowing low interest rate currencies and investing in high interest rate currencies. For instance, investors might employ the Japanese yen as a funding currency and invest in an emerging currency such as the Mexican peso. These trades are typically constructed with large leveraged positions. While usually profitable, investors have occasionally experienced significant losses due to the unwinding of positions during financial crises or periods of market turmoil. For example, the Russian default in 1998 and the global financial crisis in 2008 triggered a large unwinding of carry trade positions. Recently, the Bank for International Settlements (BIS) reported that the size of carry trade positions reached approximately 14 billion U.S. dollars in 2024, with the unwinding of leveraged carry trades exacerbating the market turmoil in August.
The profits from carry trades decline during periods of market turmoil, which are often associated with high volatility in the currency market. As a result, many investors adopt volatility as a risk management tool. However, risk measured by volatility captures only one aspect of market uncertainty. Investors frequently encounter situations in which they cannot assign a distribution of probabilities to their potential outcomes. These situations are referred to as ambiguity, which is distinct from risk measured by volatility.
A recent paper by Asano, Cai, and Sakemoto (2024) revealed that high volatility does not always result in low returns on currency carry trades. The authors introduced a measure of ambiguity in the currency market and found that when both volatility and ambiguity are high, carry trade portfolios tend to generate higher returns. They defined four market situations based on volatility and ambiguity. When volatility is higher (or lower) than the historical average, they classify it as a high (or low) volatility market. The same approach was applied to ambiguity. By identifying these market situations each month, they investigated carry trade returns in the following month.
Figure 1 provides empirical evidence of the average returns on currency carry trades using 23 currency pairs across different market situations. We observe that when both volatility and ambiguity are high (High V & High A), the average return is higher than those in the other three situations.
Figure 1. Average return of carry trades across four market situations

Note: V & A represent volatility and ambiguity. Currency portfolios are constructed using 23 currencies relative to the U.S. dollar. The sample period spans from January 1984 to May 2023.
Interestingly, this high return does not stem from an increased risk level in the carry portfolio. Figure 2 demonstrates that the risk level during this period is not significantly different from that of the other three situations.
Figure 2. Risk of carry trades across four market situations
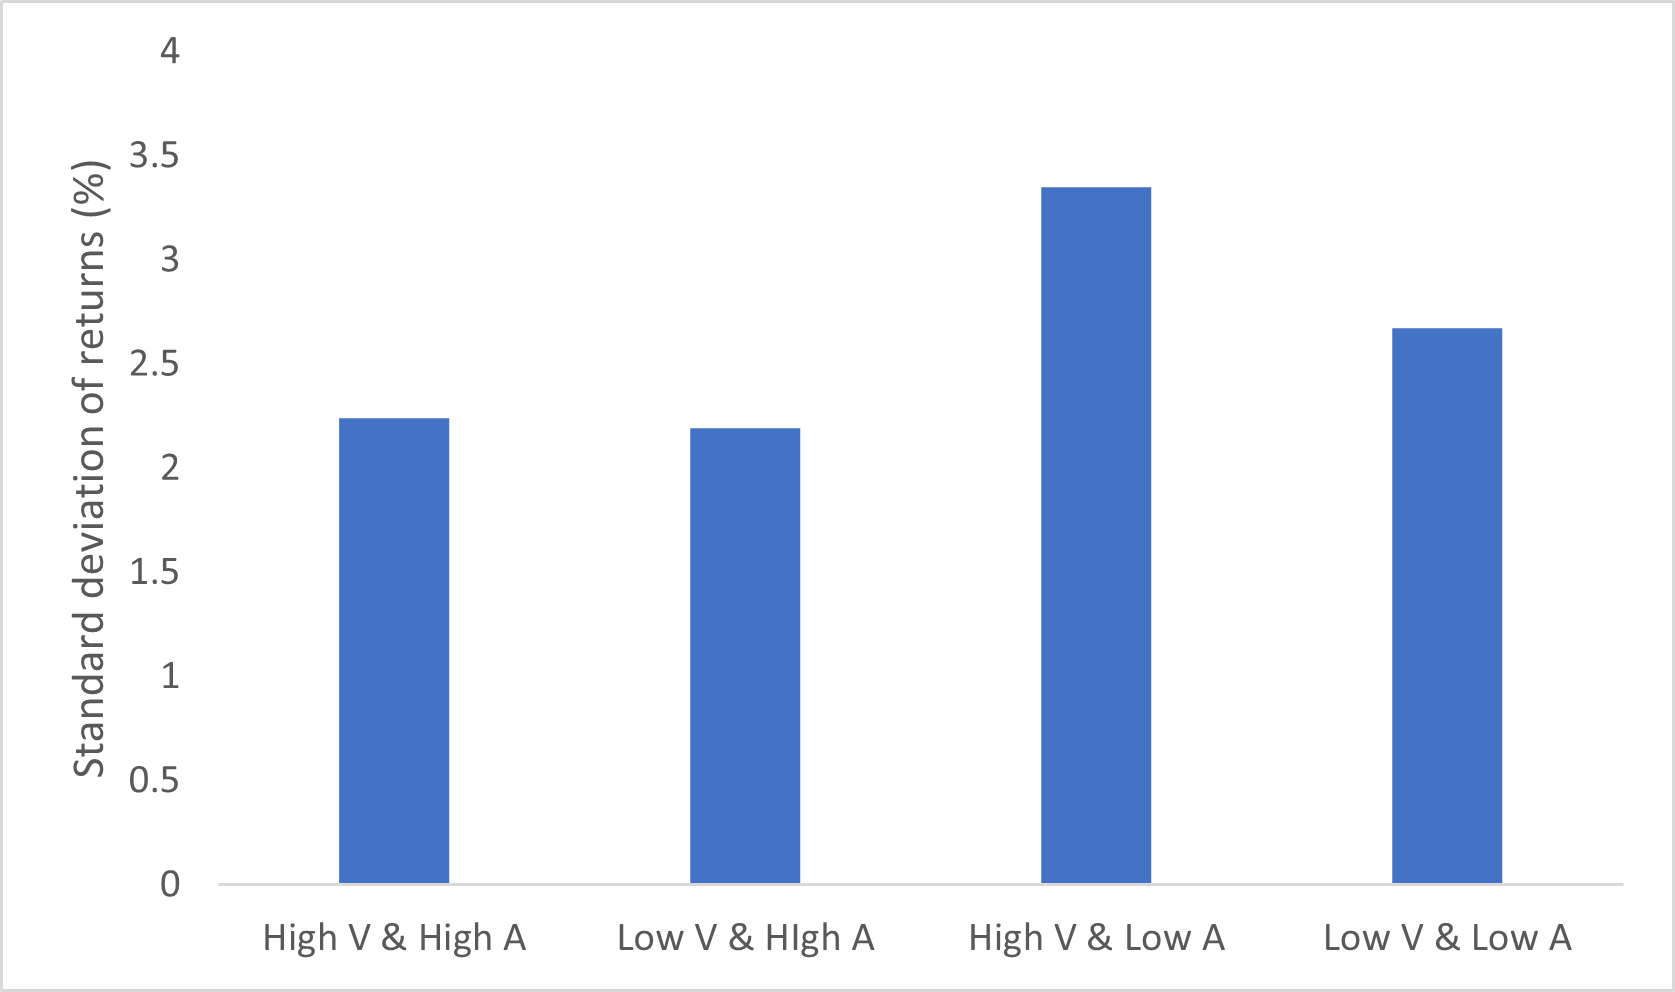
Note: Risk is calculated as the standard deviation of carry trade returns within each corresponding market situation. The sample period spans from January 1984 to May 2023.
Do investors achieve good performance only by investing during high volatility and ambiguity periods? The answer is more nuanced, as high volatility and ambiguity periods do not occur frequently. Figure 3 displays the number of months corresponding to each market situation, revealing that high volatility and high ambiguity periods are much rarer than the other three situations.
Figure 3. The number of months across four market situations
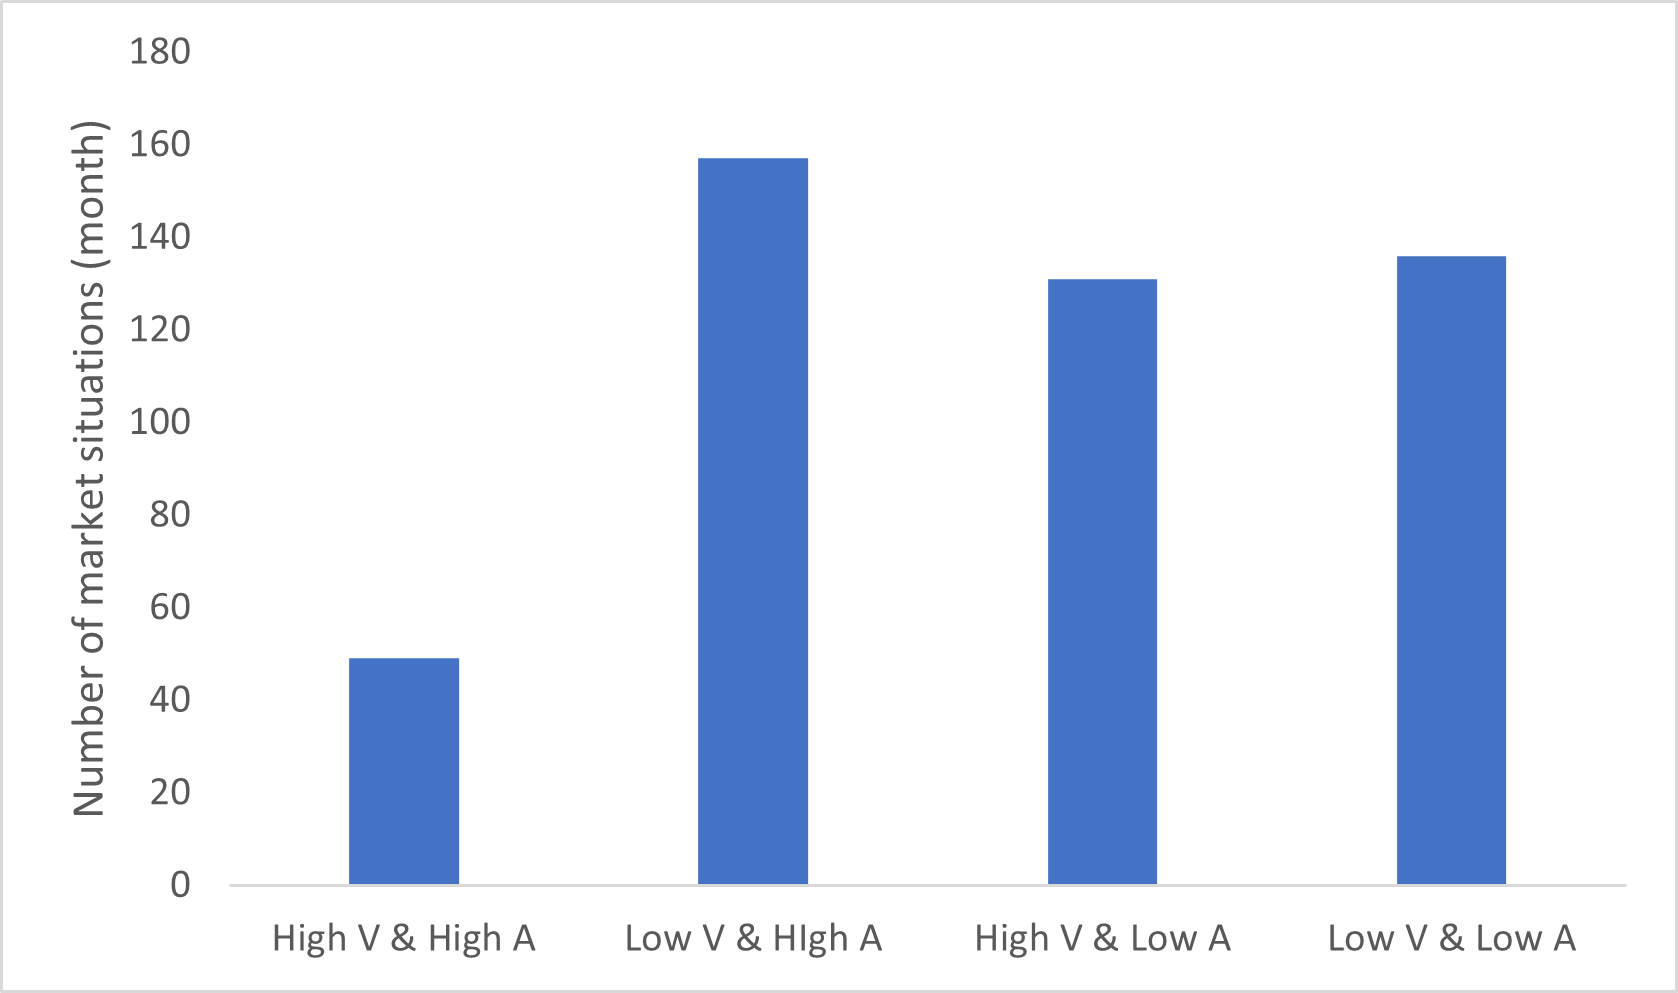
Note: The sample period spans from January 1984 to May 2023.
These results may not yield substantial profits for investors, but they do offer a valuable new monitoring tool that extends beyond traditional volatility measures.
Related links