OSE Derivatives
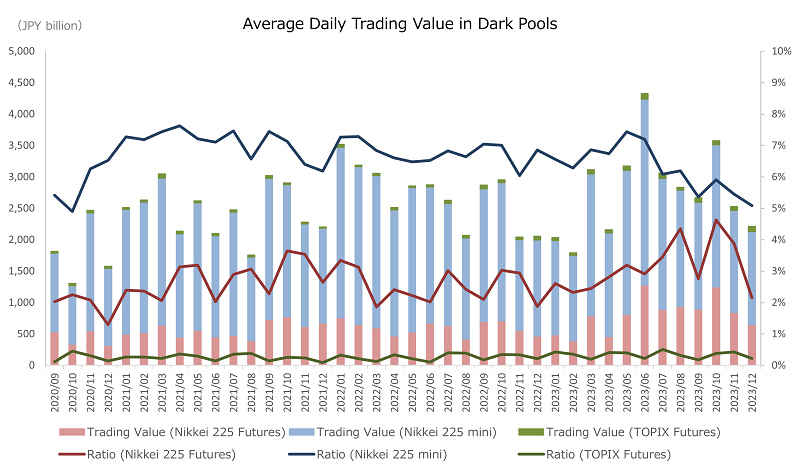
Trading Value in Dark Pools Related to Stock Index Futures (until December 2023)

In June 2019, the Working Group on Financial Markets under the Financial System Council indicated measures for increasing the transparency of dark pool transactions, such as the close monitoring of dark pool usage.
Accordingly, the Cabinet Office Order on Financial Instruments Business and the Comprehensive Guidelines for Supervision of Financial Instruments Business Operators were revised on June 19 2020, and OSE has introduced a flag system to identify orders matched in dark pools that are routed to the J-NET market to contribute to increased dark pool transparency.
Based on this flag system, we have compiled a summary of the changes in trading value in dark pools (September 2020 to December 2023), as follows:

Notes:
1. Among J-NET trading of stock index futures, dark pool flagged trading for Nikkei 225 Futures, Nikkei 225 mini, and TOPIX Futures are aggregated (excluding holiday trading).
2. Ratio of dark pool flagged trading to total trading value (right axis) is the ratio of the value of dark pool flagged trading to the total value of auction and J-NET trading.
| Nikkei 225 Futures | Nikkei 25 mini | TOPIX Futures | ||||
|---|---|---|---|---|---|---|
| ADV (billion) |
Ratio | ADV (billion) |
Ratio | ADV (billion) |
Ratio | |
| 2020/09 | 53.4 | 2.03% | 125.1 | 5.42% | 3.2 | 0.11% |
| 2020/10 | 33.5 | 2.25% | 93.0 | 4.90% | 4.3 | 0.45% |
| 2020/11 | 55.2 | 2.08% | 187.0 | 6.25% | 4.8 | 0.31% |
| 2020/12 | 31.5 | 1.30% | 122.9 | 6.53% | 3.8 | 0.14% |
| 2021/01 | 49.5 | 2.39% | 198.7 | 7.27% | 3.2 | 0.27% |
| 2021/02 | 52.4 | 2.36% | 207.6 | 7.18% | 3.4 | 0.26% |
| 2021/03 | 64.0 | 2.06% | 233.8 | 7.43% | 7.1 | 0.22% |
| 2021/04 | 44.6 | 3.14% | 164.9 | 7.63% | 4.5 | 0.36% |
| 2021/05 | 56.1 | 3.19% | 202.3 | 7.21% | 3.8 | 0.30% |
| 2021/06 | 45.3 | 2.03% | 160.8 | 7.11% | 3.9 | 0.14% |
| 2021/07 | 47.5 | 2.89% | 196.3 | 7.46% | 4.1 | 0.35% |
| 2021/08 | 39.2 | 3.06% | 132.8 | 6.57% | 3.7 | 0.38% |
| 2021/09 | 72.5 | 2.28% | 224.9 | 7.44% | 4.9 | 0.14% |
| 2021/10 | 77.4 | 3.65% | 210.2 | 7.13% | 3.3 | 0.25% |
| 2021/11 | 61.9 | 3.54% | 163.1 | 6.40% | 3.0 | 0.24% |
| 2021/12 | 67.2 | 2.64% | 150.9 | 6.18% | 2.3 | 0.08% |
| 2022/01 | 75.8 | 3.34% | 271.1 | 7.26% | 5.0 | 0.33% |
| 2022/02 | 65.1 | 3.13% | 250.9 | 7,29% | 2.8 | 0.21% |
| 2022/03 | 59.5 | 1.85% | 242.2 | 6.84% | 4.0 | 0.12% |
| 2022/04 | 46.7 | 2.41% | 200.6 | 6.61% | 4.0 | 0.33% |
| 2022/05 | 53.3 | 2.22% | 229.6 | 6.48% | 2.8 | 0.21% |
| 2022/06 | 67.1 | 2.02% | 217.0 | 6.52% | 3.6 | 0.11% |
| 2022/07 | 63.3 | 3.02% | 194.4 | 6.83% | 5.5 | 0.40% |
| 2022/08 | 42.1 | 2.42% | 160.6 | 6.64% | 4.6 | 0.39% |
| 2022/09 | 70.0 | 2.09% | 210.8 | 7.04% | 6.4 | 0.17% |
| 2022/10 | 70.8 | 3.03% | 219.9 | 7.01% | 5.1 | 0.34% |
| 2022/11 | 55.4 | 2.94% | 144.6 | 6.05% | 4.4 | 0.34% |
| 2022/12 | 46.5 | 1.87% | 153.2 | 6.86% | 6.2 | 0.22% |
| 2023/01 | 48.5 | 2.61% | 150.2 | 6.56% | 4.9 | 0.43% |
| 2023/02 | 39.2 | 2.33% | 135.9 | 6.28% | 4.4 | 0.36% |
| 2023/03 | 78.7 | 2.45% | 226.0 | 6.86% | 7.2 | 0.20% |
| 2023/04 | 45.7 | 2.82% | 164.8 | 6.74% | 5.4 | 0.41% |
| 2023/05 | 81.2 | 3.19% | 229.2 | 7.43% | 7.1 | 0.40% |
| 2023/06 | 127.6 | 2.91% | 295.9 | 7.19% | 9.3 | 0.22% |
| 2023/07 | 88.8 | 3.45% | 208.4 | 6.09% | 8.8 | 0.51% |
| 2023/08 | 93.2 | 4.35% | 185.4 | 6.20% | 4.8 | 0.32% |
| 2023/09 | 89.4 | 2.76% | 169.9 | 5.36% | 7.7 | 0.18% |
| 2023/10 | 125.1 | 4.63% | 225.8 | 5.91% | 7.1 | 0.38% |
| 2023/11 | 84.0 | 3.88% | 162.2 | 5.45% | 7.1 | 0.43% |
| 2023/12 | 64.8 | 2.15% | 148.1 | 5.09% | 8.4 | 0.22% |
Related links


