OSE Derivatives
A Guide to Nikkei Stock Average Volatility Index Futures
OSE


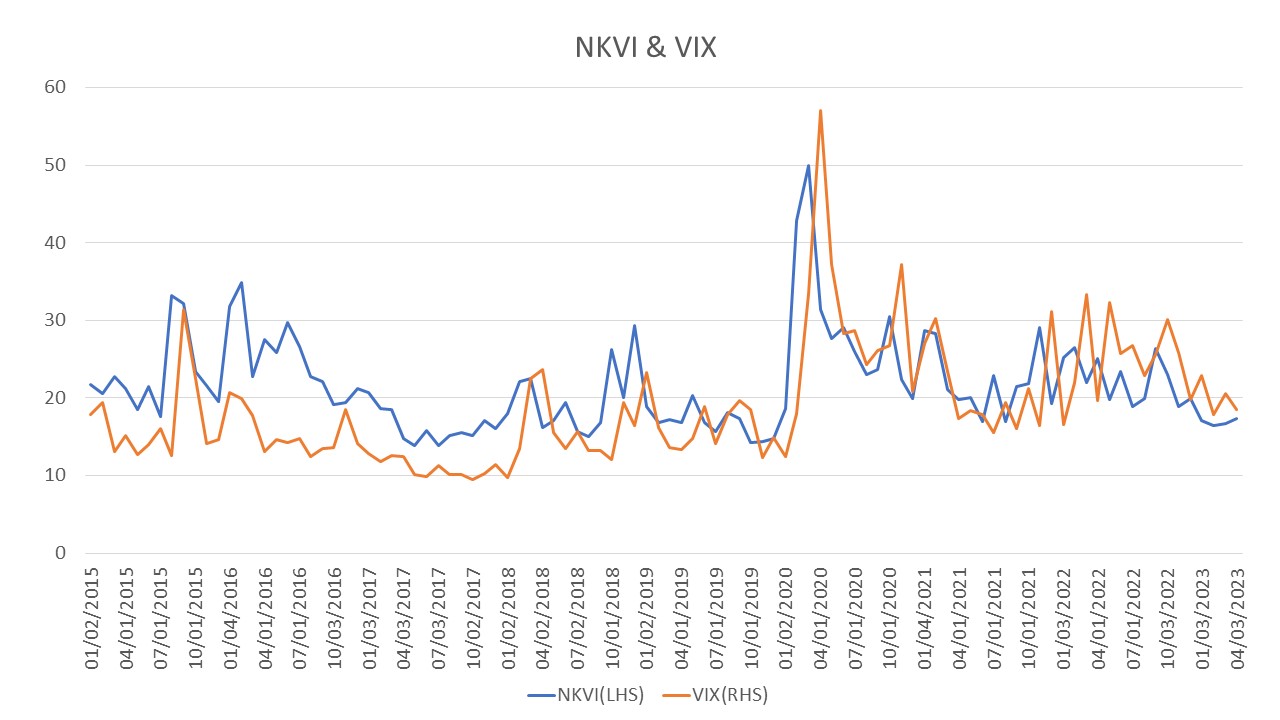
For those seeking to invest in market volatility independent of the level or direction of stock price fluctuations, there are several options. In the U.S., the CBOE Volatility Index (VIX) measures expectations of change in the S&P 500 Index. In Europe, investors may choose the Dax New Volatility Index (VDAX-NEW) or the EURO STOXX 50 Volatility Index (VSTOXX). In Japan, the Osaka Exchange (OSE) offers the Nikkei Stock Average Volatility Index (Nikkei 225 VI), which indicates future changes in the Nikkei Stock Average.
What is Nikkei 225 VI?
Nikkei 225 VI is an index calculated by Nikkei Inc. that estimates the degree of expected fluctuation in the Nikkei Stock Average. The index is calculated using prices of Nikkei 225 futures and Nikkei 225 options on the OSE, taking the near-term future price as the basis of ATM (at the money). The volatility of the near-term option and next-term option are calculated using the OTM (out of the money) option prices of each delivery month.
The index value is then calculated by linear interpolation or linear extrapolation between the volatilities of each delivery month for a time to expiration of 30 days.
For example, a Nikkei 225 VI of 30 means there is a 70% chance that the Nikkei 225 will fluctuate plus or minus 30% in one year (in the 1σ (sigma) region, assuming a normal distribution). This represents a fluctuation of plus or minus 8.6% in terms of one month.
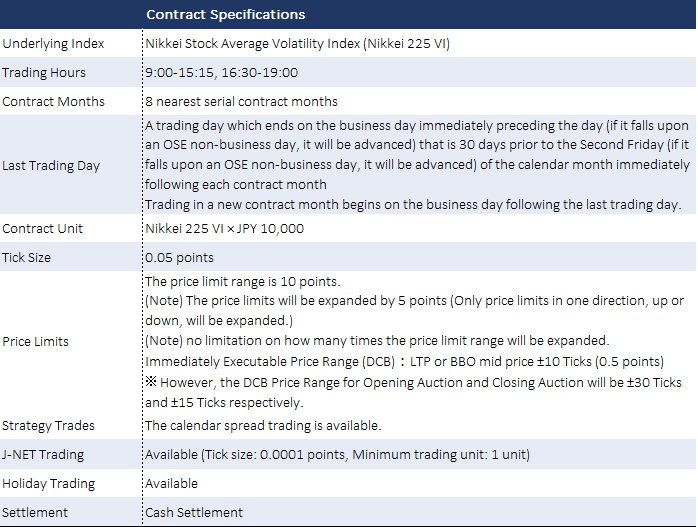
What is a Nikkei 225 VI Future?
A Nikkei 225 VI Future is a futures contract that can be traded for 10,000 times Nikkei 225 VI and is settled for the difference, based on Nikkei 225 VI at maturity.
It has the highest volatility among the stock price indexes of developed countries, for several reasons: 1) SP500 is a weighted average while Nikkei 225 is a simple average; 2) Nikkei 225 is easily affected by high stock prices due to its high-priced nature; 3) much of the trading is done by speculators.
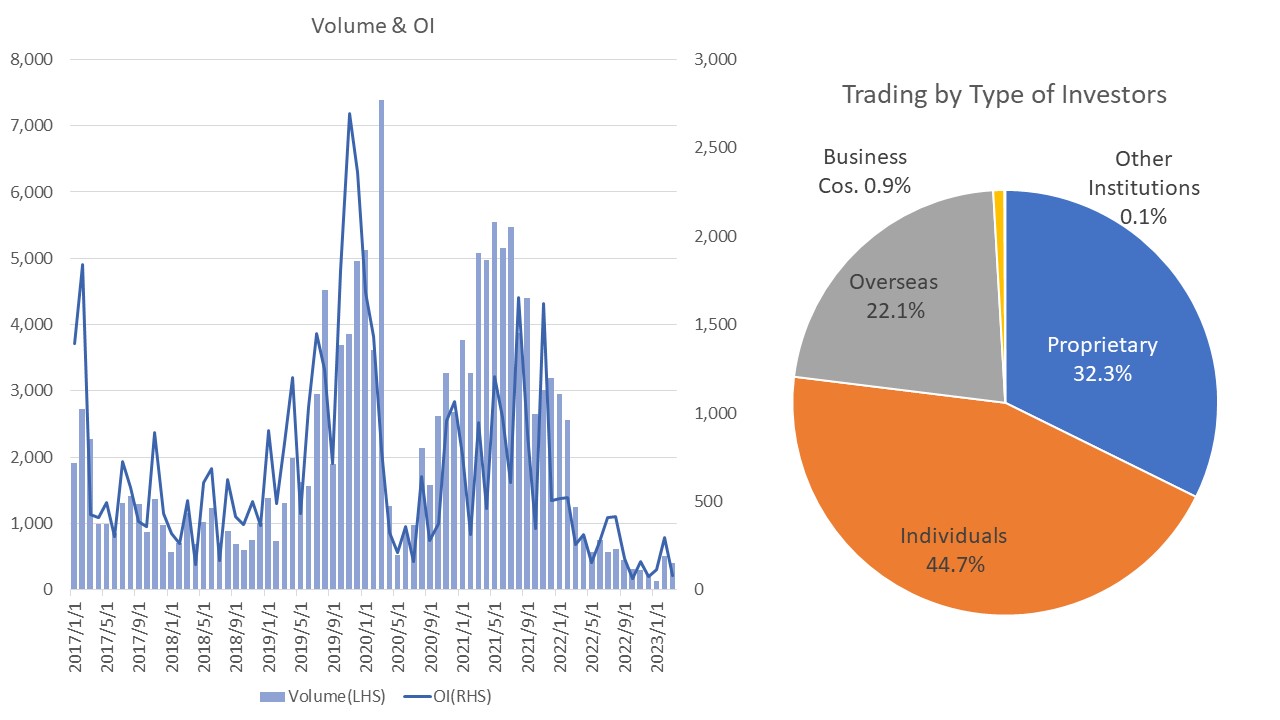
The illustrations below show trading volume and open interest, and trading by investor type for Nikkei 225 VI Futures. For FY2022, individual domestic investors account for the highest percentage of trades at about 45%, followed by securities firm proprietary trades, and overseas investors. Nikkei 225 futures contracts have a foreign investor ratio of 70% to 80%, whereas Nikkei 225 VI Futures have a foreign investor ratio of approximately 20%. Greater participation of foreign investors is expected to further improve liquidity of Nikkei 225 VI Futures.
Features of Nikkei 225 VI
1) High volatility
The Nikkei 225 VI normally fluctuates within a range of 20 to 30 points, but when the Nikkei 225 stock price declines significantly, the VI increases sharply in contrast to the Nikkei 225 stock price. For example, between Friday, March 6 and Monday, March 9 of 2020, Nikkei 225 declined approximately 5% from 20,749.75 to 19, 698.76, whereas Nikkei 225 VI rose approximately 31% from 36.41 to 47.71.
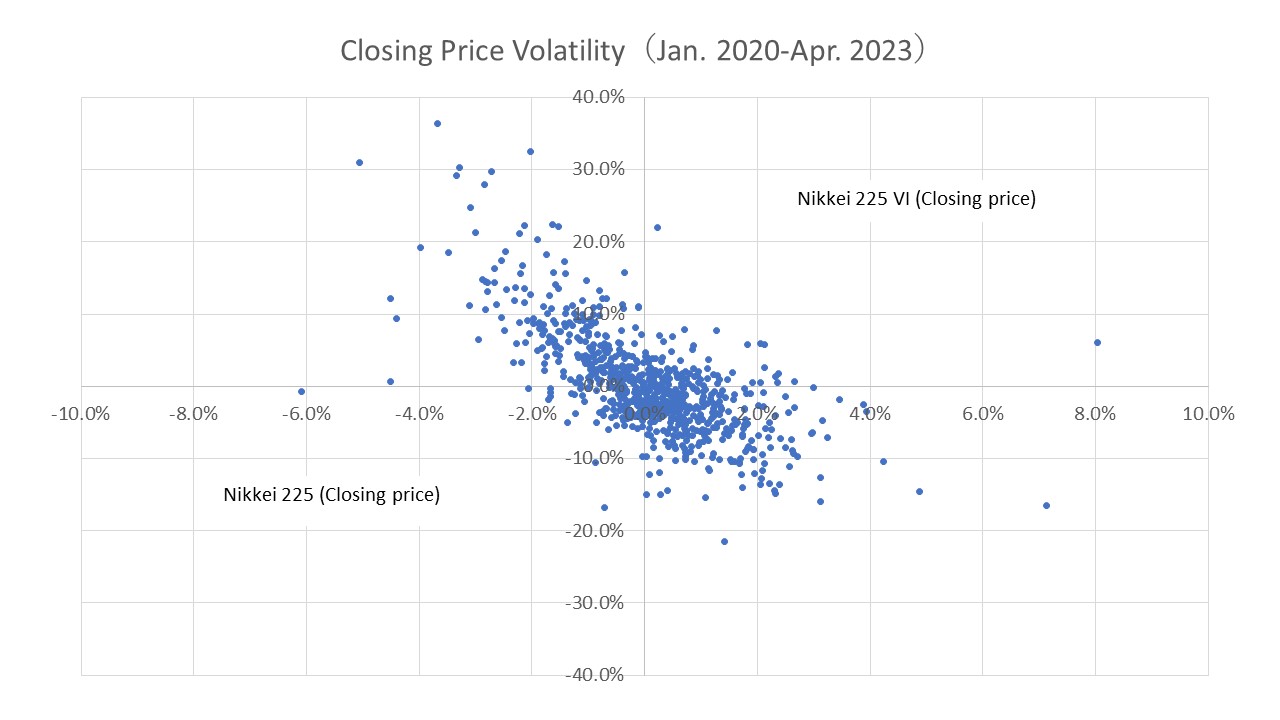
More specifically, the fluctuation rate of the Nikkei 225 VI closing price from January 2020 to April 2023, shown below, ranged from -21.5% to 36.3% (sample standard deviation of about 0.07), more than that of the Nikkei 225 during the same period, which ranged from -6.1% to 8.0% (sample standard deviation of about 0.01).
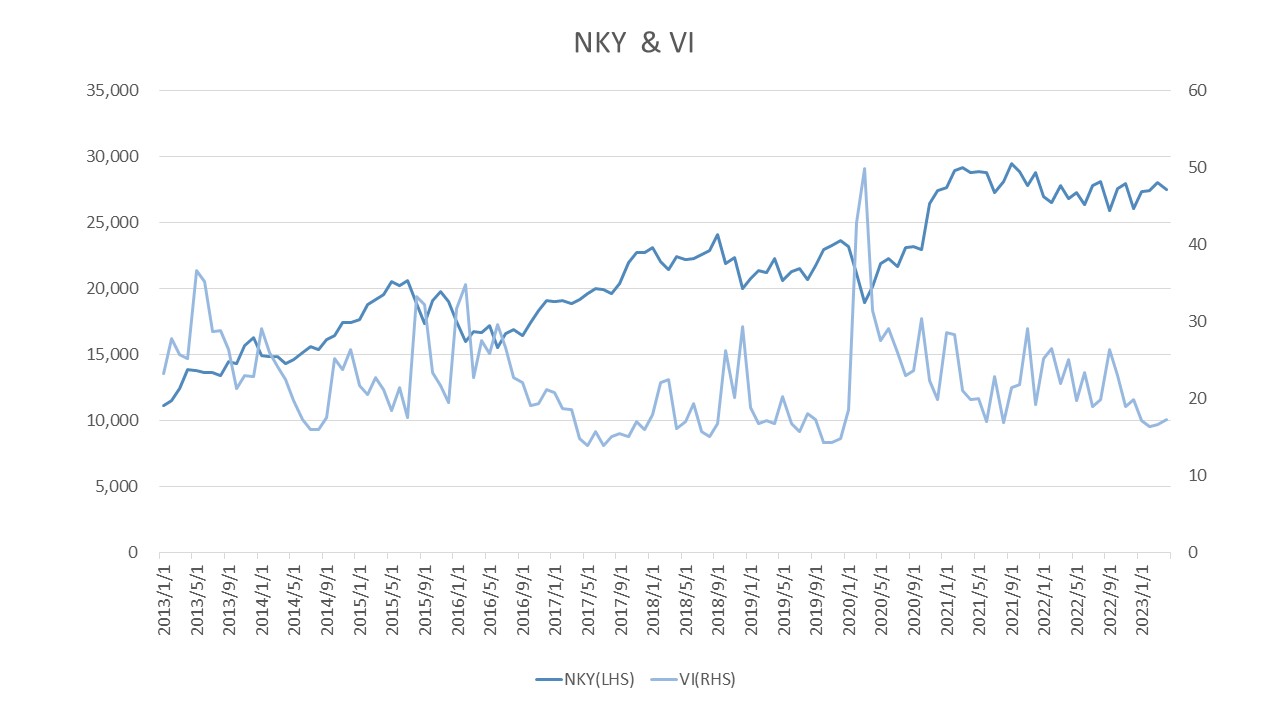
2) Mean regression
The Nikkei 225 VI rises sharply when the Nikkei 225 stock price falls sharply and tends toward a weak inverse correlation with the Nikkei 225 stock price. On the other hand, it also tends to revert to a certain range (around 20-30) after a sharp rise in value.
How to make the most of Nikkei 225 VI Futures?
1) Transactions comparing volatility over different terms
In addition to taking outright positions in volatility, calendar spread trading of Nikkei 225 VI Futures allows investors to trade against the level of volatility over different periods. For example, if the May and June contracts of Nikkei 225 VI Futures are considered overvalued in the May contract and undervalued in the June contract, calendar spread buying (selling the May contract + buying the June contract) will provide a positive return if the difference between the expected volatilities in May and June widens.
2) Hedging the risk of sharp falls in share prices and portfolio diversification
By taking advantage of the tendency of Nikkei 225 VI to spike when the Nikkei Stock Average falls sharply, holding Nikkei 225 VI Futures can act as a hedge against a temporary plunge in an equity portfolio. In addition, as the return and volatility of Nikkei 225 VI are greater than for other major assets (e.g., stocks, bonds, commodities, and real estate) and have little correlation with non-equity assets, adding Nikkei 225 VI Futures to a portfolio can achieve further portfolio diversification.
During the 2008 Lehman Brothers collapse, volatility indexes such as Nikkei 225 VI did not correlate with the prices of these assets and rose while prices of most asset classes fell.